
CI/CD Analytics: Where Pipeline Time Really Goes
A slow or failed pipeline is only a symptom. Workbench connects wasted runner time, job trends, and pipeline waterfalls in one investigation – from the aggregate signal to the exact merge request attempt.

A pipeline fails. Or it passes, but takes 27 minutes. You open GitLab, work your way through the jobs, and eventually find a test that ran twice, a Docker build that spent eight minutes waiting, and a child pipeline that almost disappears from the overall picture.
That explains one run. It does not answer the more useful question: where does our pipeline time actually go? Not just this morning, but over several weeks. Not just in one job, but across projects, runners, and merge requests. And not merely as a total, but as a signal that leads back to a run somebody can investigate.
In Never Release to Test, we answered that question through a one-off forensic analysis. We exported pipeline runs, classified the failures, and turned the findings into changes. The exercise was valuable – and that was precisely the problem. A diagnosis assembled by hand after an incident is not an instrument. It is a report.
CI/CD Analytics turns that investigation into a repeatable view inside Workbench.
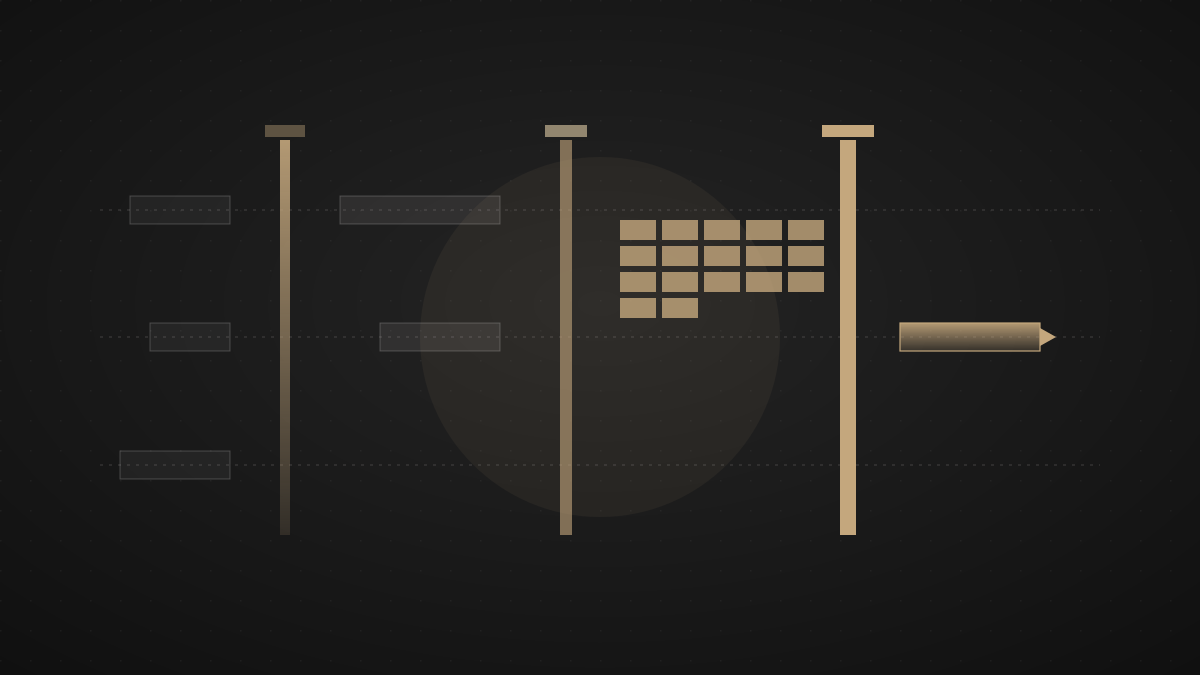
Three Views, One Investigation
The journey does not begin with a long list of pipelines. It begins with three questions, each narrowing the search.
Waste & Reliability asks where runner time was spent and how much of it ended in failed or cancelled attempts. It separates successful, failed, and cancelled time, ranks the most expensive sources of waste, and measures which gates passed on their first attempt. This is the map: where is an investigation likely to pay off?
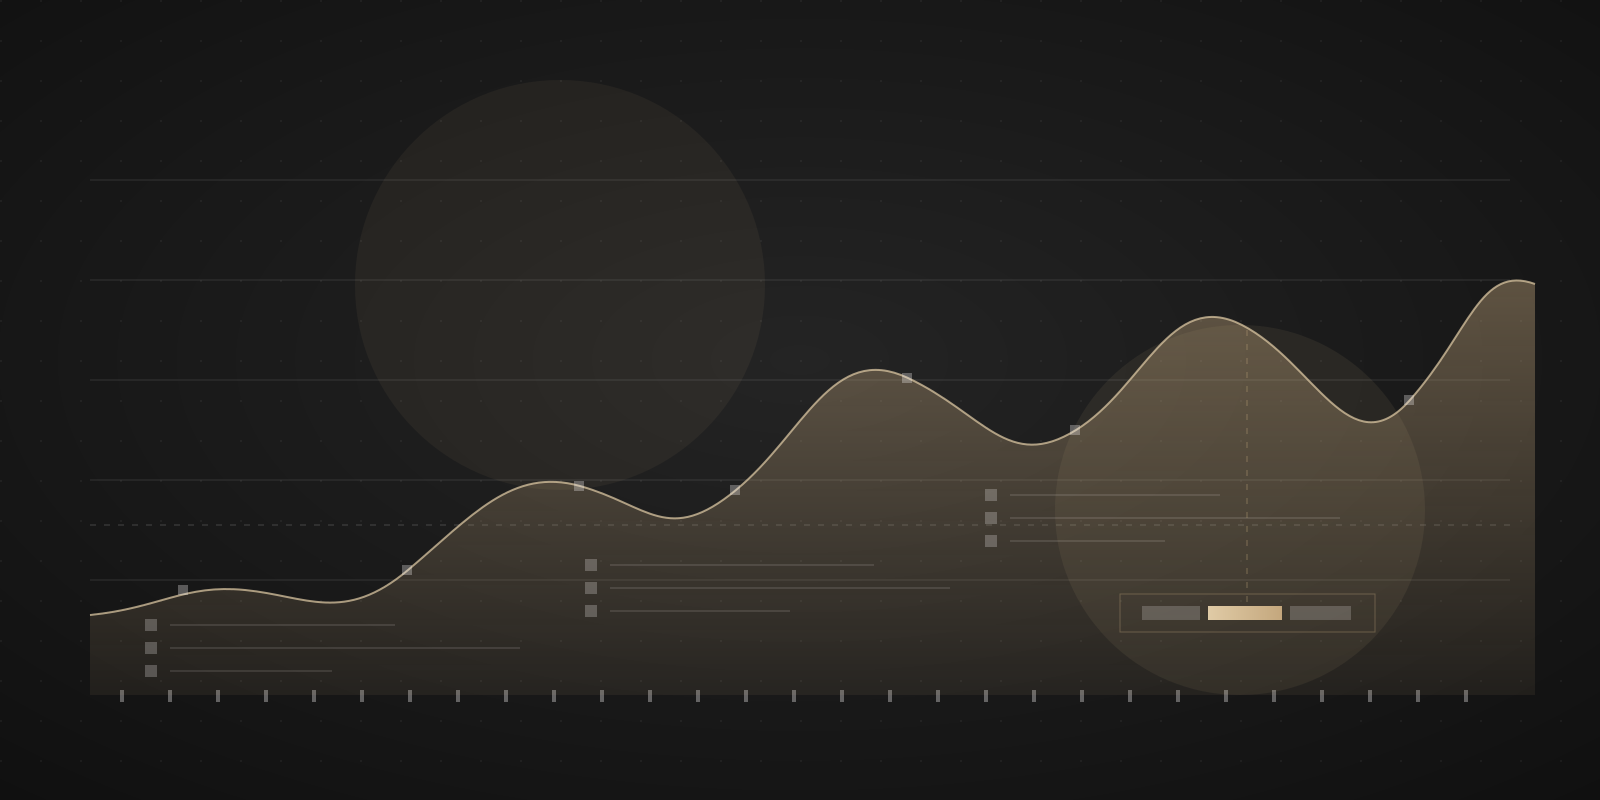
Jobs follows one of those leads. For each job series, Workbench shows its run count, failures, total and failed duration, P50 and P95, and the typical queue time before execution. The selected period is compared with the preceding period of equal length. The trend therefore answers more than “is this job slow?” It answers “is it getting slower?”
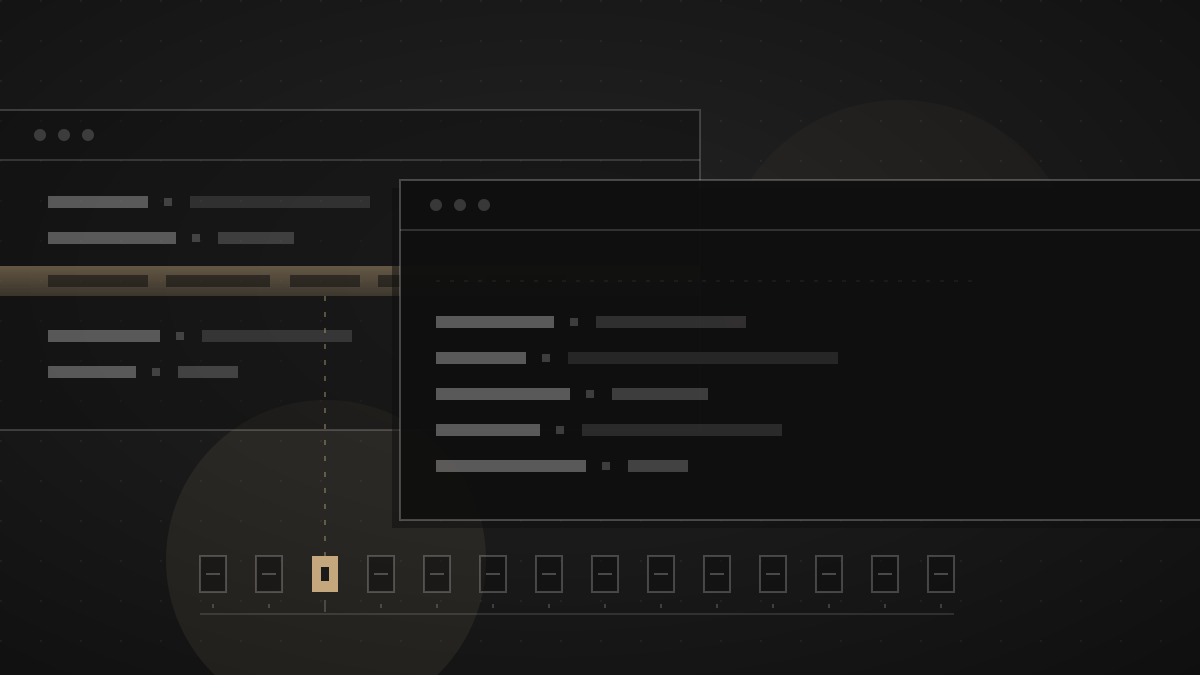
Pipelines and merge requests provide the final level of detail. A pipeline appears as a waterfall of parent and child pipelines, with their jobs aligned on a shared timeline. A merge request brings its attempts together: the first failure, a retry on the same commit, or a later success after the code changed.
An aggregate becomes actionable only when it provides a route back to the concrete run.
These are not three unrelated dashboards. They are three zoom levels in the same investigation: lost time, the job series responsible, and the exact pipeline attempt.
Every Metric Is Also a Rule
Building the interface was not the difficult part. Deciding what each number means was.
A “failure rate” sounds objective until a pipeline is cancelled, a non-blocking check turns red, or the same commit passes on its second attempt. If those cases are left implicit, a polished chart can answer a different question from the one its reader thinks they asked.
Workbench makes the counting rules explicit:
- Only successful and failed attempts contribute to outcome rates. A cancelled run consumed compute, but produced no outcome.
- Failed and cancelled jobs count as wasted runner time. Work abandoned after a newer commit or a manual cancellation does not vanish from the cost.
- Blocking and
allow_failurechecks remain separate series. Turning a gate into an advisory check must not look like an improvement in reliability. - A job is flaky only when the same job on the same commit both fails and succeeds. Failure on SHA A followed by success on SHA B is not a flake; the code changed in between.
- Rework means that a failed merge request pipeline succeeds only on a different SHA. Retrying the same commit is a different event with a different remedy.
- Below 20 observations, Workbench marks the sample as weak instead of giving a short series the authority of a long-running trend.
- GitLab’s reported duration remains authoritative. If queue time is absent, Workbench does not manufacture a precise-looking substitute.
| Tempting shortcut | Workbench definition | Why the distinction matters |
|---|---|---|
| Every failed or cancelled run is a failure | Cancellation counts as consumed time, but not as an outcome | A run without an outcome distorts neither the success rate nor the failure rate. |
| A job fails and later passes, so it is flaky | Flaky requires failure and success for the same job on the same commit | A code fix is not misclassified as unstable infrastructure. |
| Green after red is a retry | The same SHA is a retry; a new SHA is rework | Repetition and remediation call for different action. |
allow_failure belongs in the overall job rate | Blocking gates and advisory checks remain separate | Weakening a gate cannot masquerade as better quality. |
This may sound pedantic. It is the difference between a metric and an assertion. A chart can be accurate to two decimal places and still answer the wrong question.
Quiet Days Are Data Too
The same standard applies to presentation.
Our first trend view returned only buckets that contained attempts. A 90-day range with activity on four days therefore produced an axis with four categories. It looked tidy, but it concealed an important ambiguity: were the other 86 days quiet, or did Workbench possess only four days of history?
The server now returns every bucket in the selected range. Days with no attempts remain visible as gaps. Only then does absence become information.
Those buckets are generated on the server in a UTC database session. If the browser and server independently grouped the same timestamps, we would have two definitions of the timeline – and they could diverge around a daylight-saving transition. The frontend therefore renders the axis that was calculated alongside the values.
Status Must Carry Meaning
The first production use exposed another kind of ambiguity. Successful, failed, manual, and skipped jobs had different labels, but looked almost identical. CI navigation resembled a row of links rather than a set of tabs. Headers and numeric values did not line up. A failed non-blocking check looked like a broken build.
These are not cosmetic defects. In an analytics product, visual hierarchy is part of the semantics.
Status badges now make their meaning apparent: success, failure, manual, and skipped are distinguishable; a failed allow_failure job appears as an advisory warning rather than a broken pipeline. The active view reads as a tab. Numbers align with their headings. Every chart retains an accessible table representation, so its meaning does not depend on colour, a pointer, or sight.
Readability is not polish applied after the analytical work. An ambiguous presentation is a wrong answer sitting on top of correct data.
From Signal to Run
A ranking of expensive job series attracts attention. It does not create action. The person seeing the outlier still needs to reach the run that caused it.
Workbench connects those levels. A job series leads to its trend and comparison. A pipeline combines its parent and direct child pipelines in one waterfall. The merge request drilldown groups attempts so the reader can see whether the same commit merely ran again or whether a later commit changed the result. Pipeline and job names then link back to GitLab for logs, artefacts, and source code.
The public address of a pipeline run follows the same principle. The first implementation placed an internal database ID in the URL. That was convenient for the application, meaningless to the reader, and enumerable across tenants. Pipeline runs and job attempts now receive public UUIDs, and internal IDs no longer appear in the API.
A UUID does not replace authorisation. PostgreSQL Row Level Security remains the tenant boundary that prevents one workspace from reaching another’s data. The UUID has a different job: a public URL should not reveal a row’s position in an internal table, and its identity should be a deliberate interface rather than an accidental implementation detail.
Data Workbench Deliberately Does Not Collect
CI history is an exception inside Workbench. Work items, merge requests, and milestones are disposable projections of GitLab. Analytics needs history: a job that is slow today becomes interesting only in comparison with the preceding weeks.
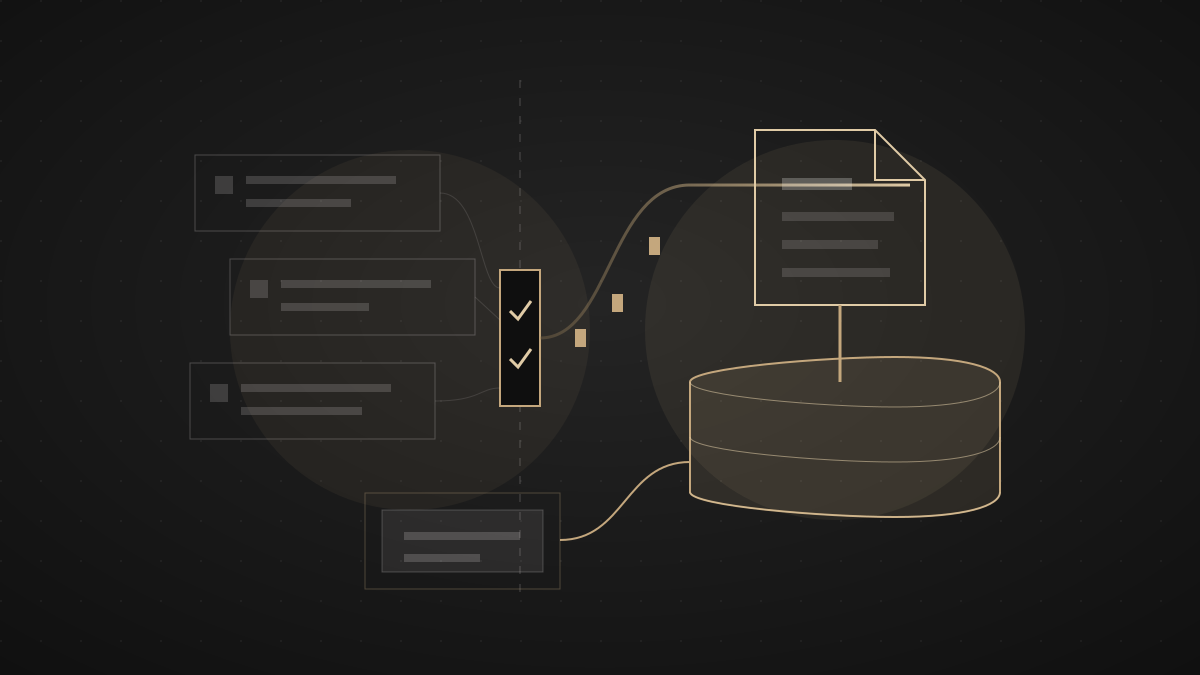
That exception is tightly bounded. Workbench retains analytics for 400 days by default and stores only what the analysis requires:
- timestamps, duration, and queue time where GitLab provides it
- status and failure reason
- job name and stage
- runner identity and tags
- associations with the pipeline, project, commit, and merge request
It does not store job traces or logs, artefacts, CI/CD variables, or commit messages. Analytics identifies where an investigation should begin; it does not become a second archive for the contents of CI.
Other boundaries remain visible. Pipeline duration is derived from the earliest job start and latest job finish, so it does not include every internal GitLab queue. Renaming a job starts a new series because its name is its comparative identity. And Workbench can analyse only the projects included in that workspace and enabled for collection.
What We Would Keep
Three principles from this work extend beyond CI/CD Analytics:
- Analytics starts with definitions. Without explicit counting rules, precise charts are merely precise renderings of ambiguity.
- Every aggregate needs a drilldown. A signal becomes actionable only when it can be traced to a concrete attempt.
- Readability is part of correctness. Complete timelines, semantic status treatments, and public identities are not decoration around the data. They determine what a reader can learn from it.
That brings us back to the opening question. Workbench does not merely show that CI consumed time. It shows where the time went, whether the cause was an unstable job, a genuine failure, or changed code – and the exact pipeline run where the investigation should continue.